
Ottawa Statistics - March 2024

Ottawa MLS® Market Shows Early Signs of a Buzzing Spring Market
In March 2024, 1,165 homes were sold in Ottawa through the MLS® System, marking a 10% increase from March 2023.
However, home sales for March were still 21.5% below the five-year average and 15% below the 10-year average.
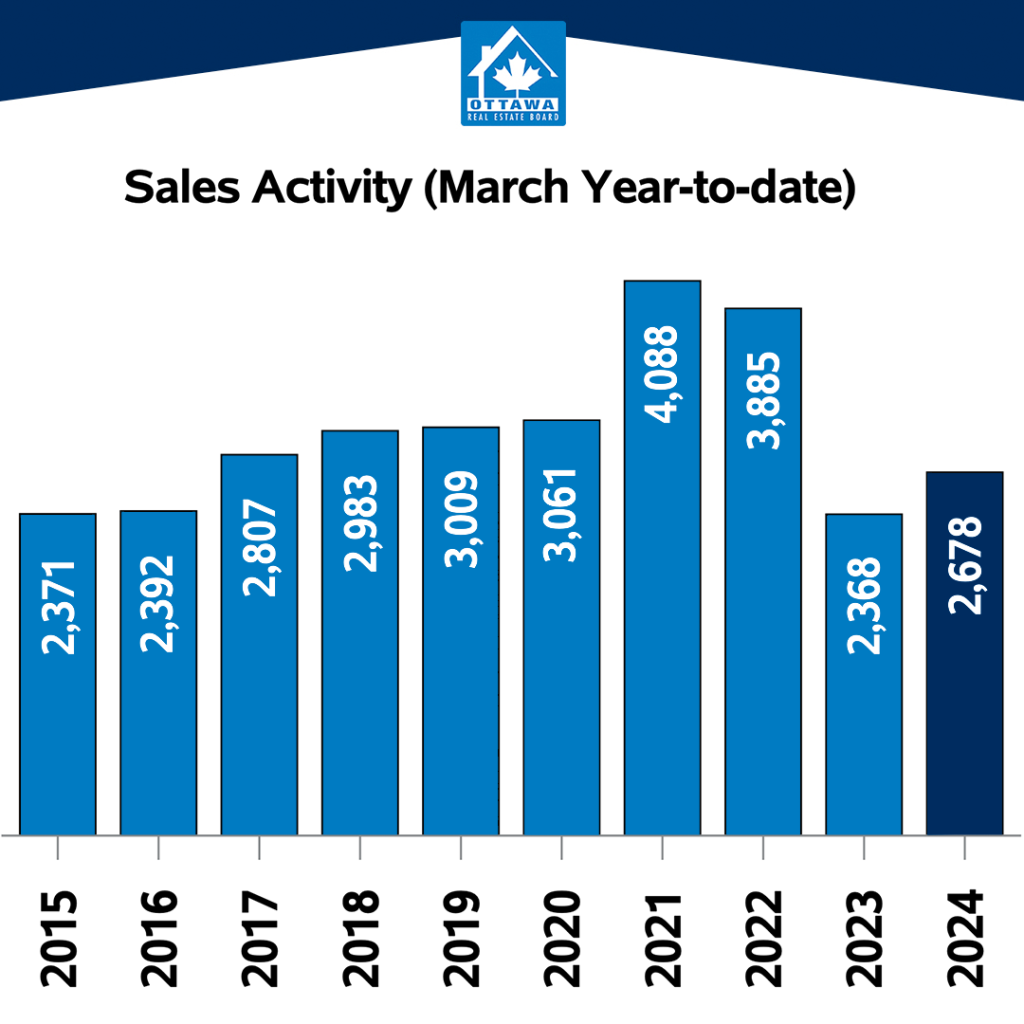
Year-to-date, 2,678 homes were sold in the first three months of 2024, showing a 13.1% increase compared to the same period in 2023.
OREB President Curtis Fillier stated that Ottawa's real estate market is healthy, setting the stage for an active spring and summer. He noted an increase in new listings, indicating sellers' growing confidence, though buyers seem hesitant possibly due to affordability and supply concerns.
Fillier highlighted a forthcoming shift in the market, as people adapt to post-pandemic life by reassessing their housing needs. This includes downsizing, relocating from the outskirts, or seeking properties better suited to their requirements, placing pressure on the mid-range property market. He advised both buyers and sellers not to delay their decisions.


By the Numbers – Prices:
The MLS® Home Price Index (HPI) tracks price trends far more accurately than is possible using average or median price measures.
- The overall MLS® HPI composite benchmark price was $636,700 in March 2024, a gain of 2.7% from March 2023.
- The benchmark price for single-family homes was $719,000, up 2.6% on a year-over-year basis in March.
- By comparison, the benchmark price for a townhouse/row unit was $489,800, up slightly at 0.9% compared to a year earlier.
- The benchmark apartment price was $423,200, up 4.3% from year-ago levels.
- The average price of homes sold in March 2024 was $682,078 increasing 5.1% from March 2023. The more comprehensive year-to-date average price was $659,828, increasing by 3.2% from the first three months of 2023.
- The dollar volume of all home sales in March 2024 was $794.6 million, up 15.6% from the same month in 2023.
OREB cautions that the average sale price can be useful in establishing trends over time but should not be used as an indicator that specific properties have increased or decreased in value. The calculation of the average sale price is based on the total dollar volume of all properties sold. Price will vary from neighborhood to neighborhood.
By the Numbers – Inventory & New Listings:
- The number of new listings saw an increase of 13.5% from March 2023. There were 2,074 new residential listings in March 2024. New listings were 2.3% below the five-year average and 11.1% below the 10-year average for the month of March.
- Active residential listings numbered 2,543 units on the market at the end of March 2024, a gain of 18.3% from March 2023. Active listings were 58.6% above the five-year average and 17.7% below the 10-year average for the month of March. Active listings haven’t been this high in the month of March in more than five years.
- Months of inventory numbered 2.2 at the end of March 2024, up only slight from 2 in March 2023 and below the long-run average of 2.6 months for this time of year. The number of months of inventory is the number of months it would take to sell current inventories at the current rate of sales activity.

 Facebook
 X
X
 Pinterest
 Copy Link
